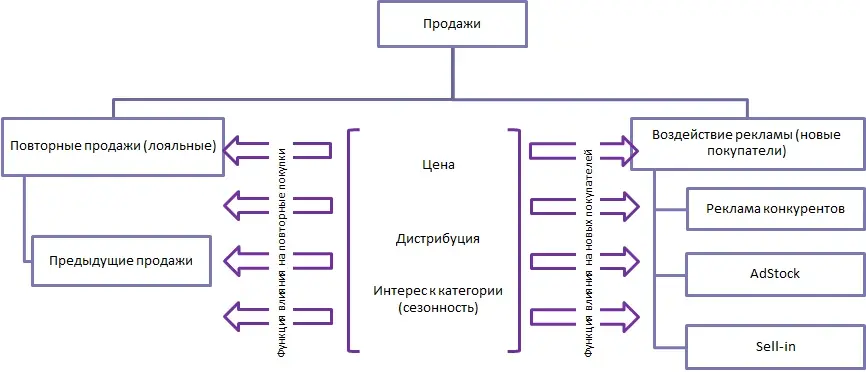
For the first time, again, on promotion, out of habit — each purchase type has its own drivers, and the model counts them separately.

Econometric modeling
Highly accurate sales forecast
The way to predict the volume of product sales with an accuracy of 95% and increase the profitability of the business.
We build sales models that weigh and quantify the influence of each factor — advertising, price, distribution, competitors and more — on product sales.
A model lets you test scenarios for planned marketing activity, advertising and price changes before they are implemented, which helps you make the right decision and brings the cost of a failed test close to zero.
The resulting formula can also show the investment levels needed in each media type to achieve a response that maximises ROI, and determine the product price that maximises off-take in the current market.
In complex models we can also capture the cross-dependency of one product on the promotion of another within the brand portfolio. The model breaks the final sales level into contributing factors and studies how response evolves when they change.
Modeling technique
01
Factors
Define a set of factors that influence the final result. Leave the significant ones, remove or neglect the insignificant ones.
02
Model
We build a model of the dependence of the result on the parameters: we make a formula or a system of formulas that most accurately describe the existing behaviour of the brand. Using various optimisation algorithms we determine the coefficients of the model.
03
Verification
The model is verified on historical sales data provided by you, with a depth of at least one year — or better, three to five years.
What mathematical methods do we use
- time series
- different kinds of multiple regression analysis
- MARSplines
- regression trees
- cluster analysis
- factor analysis
- loglinear analysis
- neural networks
- other methods necessary for a particular task
What the model accounts for
How the consumer buys the brand
Which factors drive purchase
Advertising, price, distribution, promotion, competitor activity. Each factor gets a weight — its contribution to sales, not just a note that it matters.
How factors affect each other
Advertising amplifies promotion, price changes the effect of distribution, and competitors erode part of your investment. The model accounts for these overlaps instead of treating factors as independent.
Why we use a multiplicative model rather than a linear one
A linear model assumes that every next unit of spend works the same as the previous one. In advertising that is not true: response saturates, and beyond a certain frequency additional impressions add almost no sales.
Price and distribution have the same problem. At 50% distribution, growing to 80% does not deliver the same gain as growing from 20% to 50%. And if distribution falls to zero, a linear model still shows non-zero sales — although in reality there would be none.
That is why we work with multiplicative models: factors multiply rather than add. Each next percentage point of distribution or TRP brings a smaller gain — as happens in the market.
Benefits of the sales forecast model
- ROI grows to +30%. You see graphs of response to advertising and marketing activities and determine the levels of investment needed to achieve your goals.
- Risks of marketing activities are levelled out. You are not trying out promotion approaches blindly and can independently test promotion scenarios.
- The result of the campaign is known before the launch. You know the effect of campaigns in advance.
You get the model in the format you need
01
Formula
Formula or group of formulas.
02
MS Excel workbook
An MS Excel workbook with an interface, charts and a data set that you can start working with and making predictions right away.
03
Library
A *.dll or *.ocx library that plugs into your existing software.
04
Software product
A software product with a user-friendly interface that can make forecasts, build graphs and give recommendations.
Questions and answers
Frequently asked about econometrics
Why a model is needed
Why do we need this — what can a model give me?
First of all, to know the effectiveness of planned activities in advance. You will no longer have to choose a strategy based on common sense, experience and intuition alone.
What do I get in the end?
A tool you can use on your own: enter different marketing scenarios and see the sales result they produce. We deliver it as a formula, an Excel file with an interface, a dll/ocx library — or build a dedicated software product for you.
Data
What data is needed to build a model?
Any data you have. For FMCG and pharma that traditionally means brand and category sales, distribution, price, media activity of the brand and competitors, and promotions. It helps if you have Ad Recall and know whether the message changed over previous years. Monthly data over three years — five is better: the more data and the longer the period, the more accurate the model.
What are the limitations?
We can accurately model only what has already happened. If you advertised on TV and radio, the model will predict the effect of TV and radio, but not of press, online or out-of-home. The second limitation is data volume: a sample of ten measurements will not produce a quality model.
Can you model something that has never been done before?
Reliably — no, but we can make assumptions. For example, look at that channel's contribution for competitors and transfer it to you with adjustments. Or, if you only had radio, take the radio response and assume TV will be stronger thanks to visuals. These are assumptions, and their accuracy is lower than the rest of the model.
What if my product is completely new?
Two ways. First: take the closest competitor in positioning and price, build a model on it and adjust with common sense. Second: follow the awareness — purchase — repeat purchase path based on category averages.
Can a model always be built?
Not always — most often the obstacle is the lack of quality historical data. Before every project we assess the amount and quality of the data and tell you if it is not enough.
Which categories have you worked with?
Pharmaceuticals, retail, fuel stations, education, FMCG, medical equipment, automotive.
How the model is built
What types of models do you build?
The type follows the task. Most often a multiplicative model. Sometimes an ordinary regression — for a building materials store, for example. With large data volumes and predictable inputs, regression trees can be used. We use neural networks as a last resort: their logic is hard to explain and optimal investment levels are hard to determine. Multiplicative regressions are easier to interpret and easier to base optimisation recommendations on.
Why do you not use additive regression?
In an additive model every parameter is a summand, which does not match reality. Distribution is 50% today: grow to 80% and sales should add 50–60%; drop to zero and there are no sales at all. In an additive model distribution is just one summand: set it to zero and the other parameters will not add up to zero, while doubling it will not come close to the logical 90–100%.
How do you find the formula for the model?
We analyse buyer behaviour: do they repurchase, how often, what drives new and returning buyers. Then we build a formula that describes it as closely as possible.
Tell us more about the process.
We collect sales and media activity data, put it into a table and load it into statistical software. We test formulas and optimise coefficients, moving from simple to complex and adding variables. We stop when new variables no longer improve accuracy.
Accuracy and guarantees
Are your models really that accurate?
Practice shows that with enough data and a properly built model, accuracy is high — we have many examples and checks behind us.
Which regions can you build a model for?
Any: Russia as a whole, individual regions, million-plus cities such as Moscow and St Petersburg, and foreign markets such as the US. With wide geography and no need for a per-region forecast, one national model is better: accuracy is higher because data collection errors cancel out.
What guarantees do you give for the model?
The model works accurately while new data stays within the range used for modelling. If you advertised 200–600 TRP per month on TV and continue in that corridor, the response is predicted very accurately. Beyond the range — 1200 TRP, say — the error grows, and we account for it in the coefficients. On top of the model we develop campaign strategy and tactics and give financial guarantees for the KPIs built into it.
Does the model need updating, and how often?
Yes, quarterly is advisable — optimisation is enough, and we do it for a nominal fee. If something extraordinary happens, such as a new player entering with big budgets, it is worth re-modelling a few months later.
Timing and cost
How long does it take to build a model?
It varies. The formula and coefficient optimisation for a cold remedy took two hours after data collection and aggregation. A model for fuel stations took two weeks. Knowing the category, we will give you a realistic timeline.
How much does modelling cost?
The price depends on the task, the amount of source data and the forecast metrics you need — we will calculate it for your case. If we provide strategic and tactical media planning and buying, modelling is free of charge. We have extensive experience in communication and strategic media and marketing planning, media buying, budget optimisation and analytics.
Next
Increase your ROI to +30%
And stop testing marketing plans blindly.
METHOD MEDIA
Assured Ad Solutions
115114, Moscow, Derbenevskaya emb.,
bld. 7, str. 9, BC "Novospassky"
bld. 7, str. 9, BC "Novospassky"
Privacy policy
© 2020–2026 Method Media
© 2020–2026 Method Media